Quantilan Marketplace

Execution infrastructure.
Reference strategies prove it.

One execution engine — any signal source. One agent · one account · one strategy. Reference strategies via Telegram bot, plus OrderFlow liquidity context. You keep custody; we deliver signals and market data.

Market intelligence · License key

OrderFlow

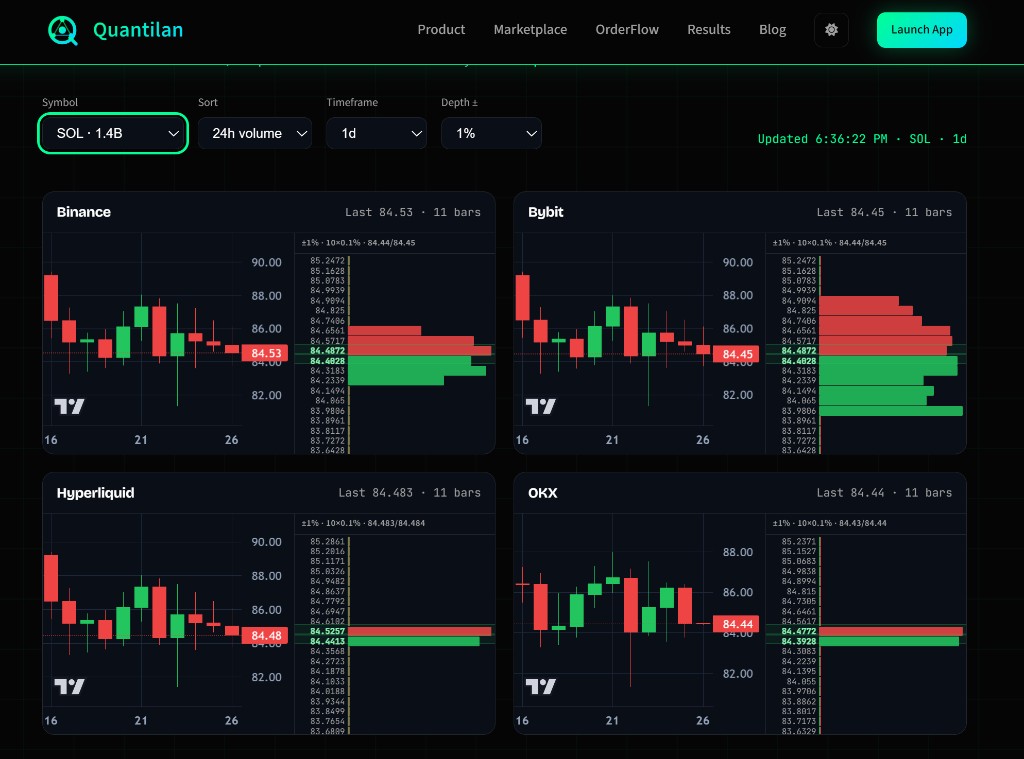
WebSocket order flow from Binance, Bybit, Hyperliquid and OKX — composed into liquidity density zones, not raw tape noise.

  • Four exchange panels · 33 coins · sort A–Z or 24h volume
  • Candles built from live trades · TF 5m > 1w
  • Right column: ranked liquidity zones per venue
  • Updates every ~2s · same license keys as Quantilan bot
OrderFlow: candles and book liquidity on Binance, Bybit, Hyperliquid and OKX
Live preview · SOL · 1d · ±1% book profile on 4 venues

One execution engine.
Reference strategies prove it.

One risk controller, any signal source — TradingView, AI, your own algo, or a reference strategy from the catalog. One agent · one account · one strategy. RSI Crossover, BearBull, and BearBull Alt are backtested demos (6 years, Binance USDⓈ-M, 5% margin, x5). Free while we grow the catalog.

Reference Strategy · Quantilan team

RSI Crossover

Mean-reversion pullback strategy

FREEnow
Annual Returns (2021–2026)
2021
+9.2%
2022
+130.3%
2023
+100.3%
2024
+145.0%
2025
+83.9%
2026
+37.3%
Total PnL · 6 years +506.10%
+84.4%
Avg / Year
53.9%
Win Rate
−19.1%
Max DD
80%
Capital Exp. (max)
0.75–12%
Risk Exp.
Reference Strategy · Quantilan team

BearBull

Trend-following bear/bull retest strategy

FREEnow
Annual Returns (2021–2026)
2021
+48.9%
2022
+53.9%
2023
+32.1%
2024
+69.7%
2025
+19.3%
2026
+14.2%
Total PnL · 6 years +238.10%
+39.7%
Avg / Year
59.1%
Win Rate
−10.54%
Max DD
35%
Capital Exp. (max)
0.75–5.25%
Risk Exp.
Reference Strategy · Quantilan team

BearBull Alt

Expanded BearBull portfolio — 18 altcoins

FREEnow
Annual Returns (2021–2026)
2021
+54.1%
2022
+107.8%
2023
+52.0%
2024
+269.6%
2025
+26.1%
2026
+34.6%
Total PnL · 6 years +544.11%
+90.7%
Avg / Year
59.3%
Win Rate
−17.65%
Max DD
90%
Capital Exp. (max)
0.75–13.5%
Risk Exp.

Beats passive investing.
By 4×+ over 6 years.

Same period 2021–2026. Quantilan strategies (non-compounded annual sum) vs compounded buy & hold on S&P 500 and Bitcoin. Backtested; not a guarantee of future results.

Total PnL · 6 years (2021–2026)

BearBull Alt
+544.11%
RSI Crossover
+506.10%
+308.85%
BearBull
+238.10%
Bitcoin B&H
+116.13%
S&P 500 B&H
+115.72%

Bar width scaled to BearBull Alt (+544.11%). Benchmarks: passive index and spot BTC hold.

Head-to-head metrics

Strategy Total PnL (6y) Avg / Year Win Rate Max DD
BearBull Alt +544.11% +90.7% 59.3% −17.65%
RSI Crossover +506.10% +84.4% 53.9% −19.1%
BearBull +238.10% +39.7% 59.1% −10.54%
Bitcoin B&H +116.13% ~19.4% −64.3%
S&P 500 B&H +115.72% ~19.3% ~−18%
Methodology
  • Same 0.75% risk per trade across all reference strategies
  • Risk exposure scales with concurrent positions — 0.75% per trade, up to coin count (RSI 0.75–12%, BearBull 0.75–5.25%, BearBull Alt 0.75–13.5%)
  • Non-compounded annual returns — balance resets each year; six-year total = sum of annual returns
  • Capital exposure differs by strategy — margin per position (RSI 80%, BearBull 35%, BearBull Alt 90% at 5%)

S&P 500 and Bitcoin buy-and-hold use compounded total return in the benchmark comparison above.

Two strategies, one book.
50 / 50 mix.

The mix is two agents, two accounts, one book — not two strategies in one process. BearBull Alt carries 2024; RSI carries 2022–2023.

50%
RSI Crossover
16 coins · mean-reversion

mix = 0.5·BB_alt + 0.5·RSI Weighted sum of two independent books. One agent · one account · one strategy.

Yearly returns

Year BB Alt RSI Mix 50/50
2021+54.1%+9.2%+31.6%
2022+107.8%+130.3%+119.1%
2023+52.0%+100.3%+76.2%
2024+269.6%+145.0%+207.3%
2025+26.1%+83.9%+55.0%
2026 YTD+34.6%+37.3%+36.0%
Σ 6 years+544.2%+506.0%+525.2%

Each year starts at $10k — no compounding across years. Mix = weighted sum of annual %.

Drawdown (estimate, not a joint curve)

Year BB Alt RSI Mix if DDs coincided*
2021−11.4%−15.4%~−13%
2022−14.9%−13.2%~−14%
2023−12.9%−12.1%~−12%
2024−12.3%−16.3%~−14%
2025−17.7%−19.1%~−18%
2026 YTD−14.9%−16.7%~−16%

*If drawdowns coincided in time: 0.5·BB_alt + 0.5·RSI. Joint DD is usually lower — peaks rarely sync. Not a single-portfolio equity curve.

Mix Σ +525.2% Avg / Year +87.5% Worst mix year +31.6%
How to read this
  • One agent · one account · one strategy — the mix is two separate agents on two accounts, not one process running two books.
  • 50/50 BearBull Alt + RSI — a third sleeve is temporarily hidden while under development; majors-only BearBull stays a separate reference strategy.
  • Same 0.75% risk per trade on each sleeve — the mix does not average losers with extra capital.
  • Non-compounded — annual balance reset; six-year total = sum of yearly mix returns.

Why This Ecosystem Works
Signals, context, your keys

OrderFlow context

See where liquidity stacks on four venues before you size a trade — complementary to strategy signals, not a replacement.

Faster Execution

Product delivery and execution stay in one pipeline, reducing delay between signal and order confirmation.

No-Custody Control

API keys and funds remain under user control. Quantilan handles delivery and tooling, not custody.

Risk Context Upfront

Before execution, users see position size, money risk, SL/TP and RR in Telegram with validator safeguards.

For Channel Owners

Provider onboarding, cabinet logic, and product administration are now moved to a dedicated page.

Important: marketplace sales attribution for channel products requires a connected Quantilan scanning bot in the channel. Plain Telegram forwards may bypass this sales channel.

Open Channel Owners Page Contact Support